2012年5月14日 星期一

http://wallblog.co.uk/2012/02/08/the-rise-of-visual-journalism-why-infographic-thinking-is-not-a-fad/

Interesting video interview here with designer Francesco Franchi, from Italy’s Intelligence in Lifestyle magazine, who talks about “infographic thinking” and “visual” journalism”.

Franchi says that “visual” journalism” combines the graphic and narrative, which he describes as a “representation and an intereptation of reality to develop an idea”.


Read more: http://wallblog.co.uk/2012/02/08/the-rise-of-visual-journalism-why-infographic-thinking-is-not-a-fad/#ixzz1utPJ4tfC

2012年5月8日 星期二

the criteria for designing an information graphic

here is the criteria which might be helpful to examine an information graphic and selected by me.


1.Graphic structure
A visual form is a logical extension of information


2.Efficiency
Easily to decode the information from the graphic


3.Aesthetic feeling
An appealing graphic to communicate the information


4.Get close to the audience
Appropriate balance between graphic and text


For example, the following picture is telling the main languages uses in Taiwan.


1.Graphic structure
A visual form is a logical extension of information
V this graphic express Taiwan by the island herself.

2.Efficiency
Easily to decode the information from the graphic 
V through the dialogue frame, three kinds of language is easily expressed. 

3.Aesthetic feeling
An appealing graphic to communicate the information
  the graphic itself is not a appealing one for general public due to the color and the shape is not vivid enough to attract. 

4.Get close to the audience
Appropriate balance between graphic and text
V the graphic has occupied 80% of the layout, will more attract people than the text only.


2012年5月7日 星期一

the mind map of information graphic

the mind map of information graphic
made by me
謹以此試圖記錄圖表設計的所有元素


information graphic=information+graphic (obviously).
due to the information and the graphic itself has covered very wide range in professional area,
the mind map below only provides a micro range of research .
個人認為, 圖表設計=圖表+設計, (好像是某種程度上的廢話)
由於圖表與設計本身就很多可以討論的了, 所以此圖也未必有表現出所有涵蓋的範圍


2012年4月30日 星期一

the information graphic in my life-2 (others)

台灣路上的一些圖表設計
包含圖表, 流程圖, 標示設計, 使用說明等等
可做於指示與廣告功能

here documented the diagrams and maps i met during a short time in Taiwan.

diagram is one of the most popular information graphic in or daily life,
use to explain how things work, the process, the instruction.


a instruction of using toilet


a diagram of the "weapons" which Taiwanese use in demonstrations


the toilet signs in National History Museum


map for tourist in Taiwan


using diagram as an advertise


2012年4月23日 星期一

the information graphic in my life-1 (pictogram)

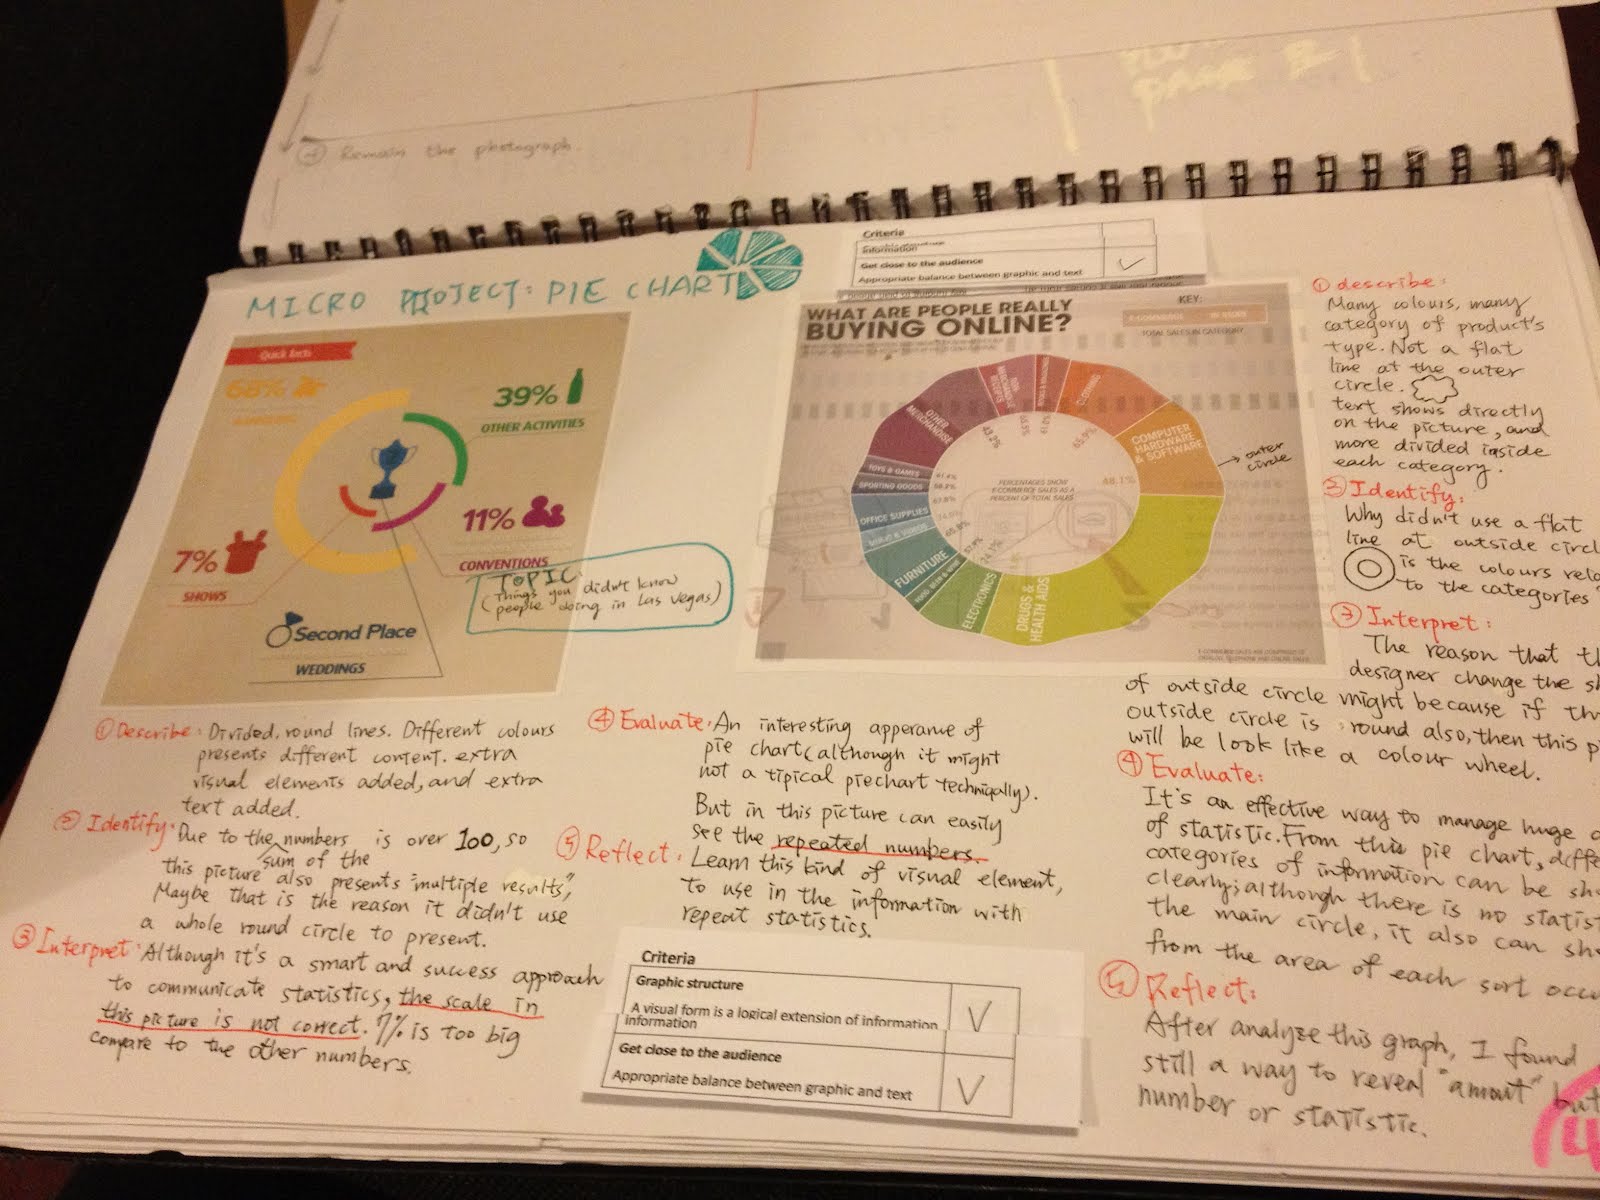
most of people in my hometown knows graphic design, but they have no idea what information graphic is. Actually, information graphic is in our life. here's some information graphic captured by me which are surrounded in my daily life. 

this article documented the graphics on the path of my daily, 3/4/12~20/4/12 in Taiwan. 

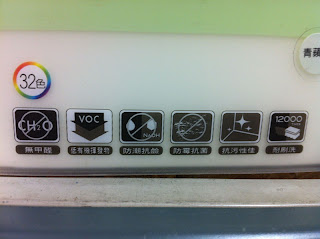
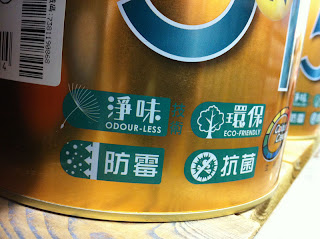
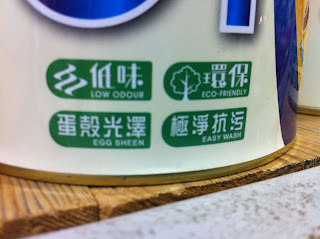
the pictogram for package

1. on the cans of paint 

the graphic designer tried to use pictogram to highlights some feature of the paint. but the graphic does not work in some situation.


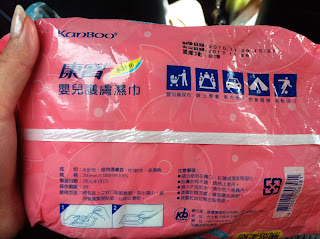
2. on the cover of the wet wipes


3. on the cartons of vacuum cleaner


the pictogram on the street


1. the sign of repair station in front of a 3C products store.


same store, indicated the forbidden behavior in it.  (no pet, drink, picture and smoking.)


 in a shop sign, in front of a coffee shop. (provides cafe, cake, tea and bread.)


shop sign of the convenient store (this branch provides toilet, place for eat and free wifi.)


the last one was took in Birmingham. what can pictogram can be a kind of guide in a retailer enviornment.

2012年3月27日 星期二

Our life in the future

http://www.mydesy.com/the-future-is-now07

Here is an very interesting article which is talking about what our life might going to be in the near future.
Basically, most of the trends shows due to the apple company and their skirts effect to other industry, our life will occupied by touch screens in the near future. (base on the internet, of course) All the information display will be a little different alter by the devices we use.
It is a quite interesting topic because it means the requirement for UI and information designer will increase. Sound like a good mews for me? Maybe I should think and practice more about the catalogue of symbolic study which more related to the subjects like this.

A short lecture: understanding and applying 5 key principles of information graphic design

Recently i am doing the lecture,
"understanding and applying 5 key principles of information graphic design",
here is the graphic I made and going to use it to talk.

This peice of information graphic illustrated the population of the main 3 races in Taiwan, target audience is 8-12 years old chrildren.

2012年3月3日 星期六

The interview of Steve Duenes

An interview in 2008, talked by Steve Duenes, the graphic director of New York Times.

http://www.nytimes.com/2008/02/25/business/media/25asktheeditors.html?_r=3&oref=slogin&oref=slogin

2012年2月9日 星期四

three steps in creating an infographic

three general steps in creating an infographic ( in my point of view )

1. story
to think and decide what kinds of information does your audience like. describe a story.

2. data
collect and gather all the relevant, right data.

3. design
DESIGN. use easy software to have a draft. the rest of this stage only requires a graphic designer. how eye-catching the work is in some situation is the only criteria.

Reference and Inspiration resources

infographic related sites


圖研所
http://www.tuyansuo.com/
Massive collection of graphic works.

Visual.ly
http://visual.ly/about
The world's largest community for sharing infographics and data visualizations

Data visualization
http://pinterest.com/elizzra/data-visualization/

there are variety websites related to infographic, Vimeo has the ones with motion, Behance and Flicr has the group of information structure and infographic groups.

self learning in infographic

Research, analyze, redesign and some prototype design in datalogy + typical infographic.


this picture shows the process of collecting information(element) to visualize


tried to transform them into image


a diagram which describing the map of my accommodation.


the study in different visual way in pie chart.


a prototype re-design of the topic of sea level rises.

2012年2月7日 星期二

InfoGraphic Designs: Overview, Examples and Best Practices


http://www.instantshift.com/2009/06/07/infographic-designs-overview-examples-and-best-practices/

the article here documented the basic knowledge of information graphic.
includes what is it, how to make it and when can I use it.
recommend to anybody who want to learn this media.