this picture shows the process of collecting information(element) to visualize

tried to transform them into image


a diagram which describing the map of my accommodation.

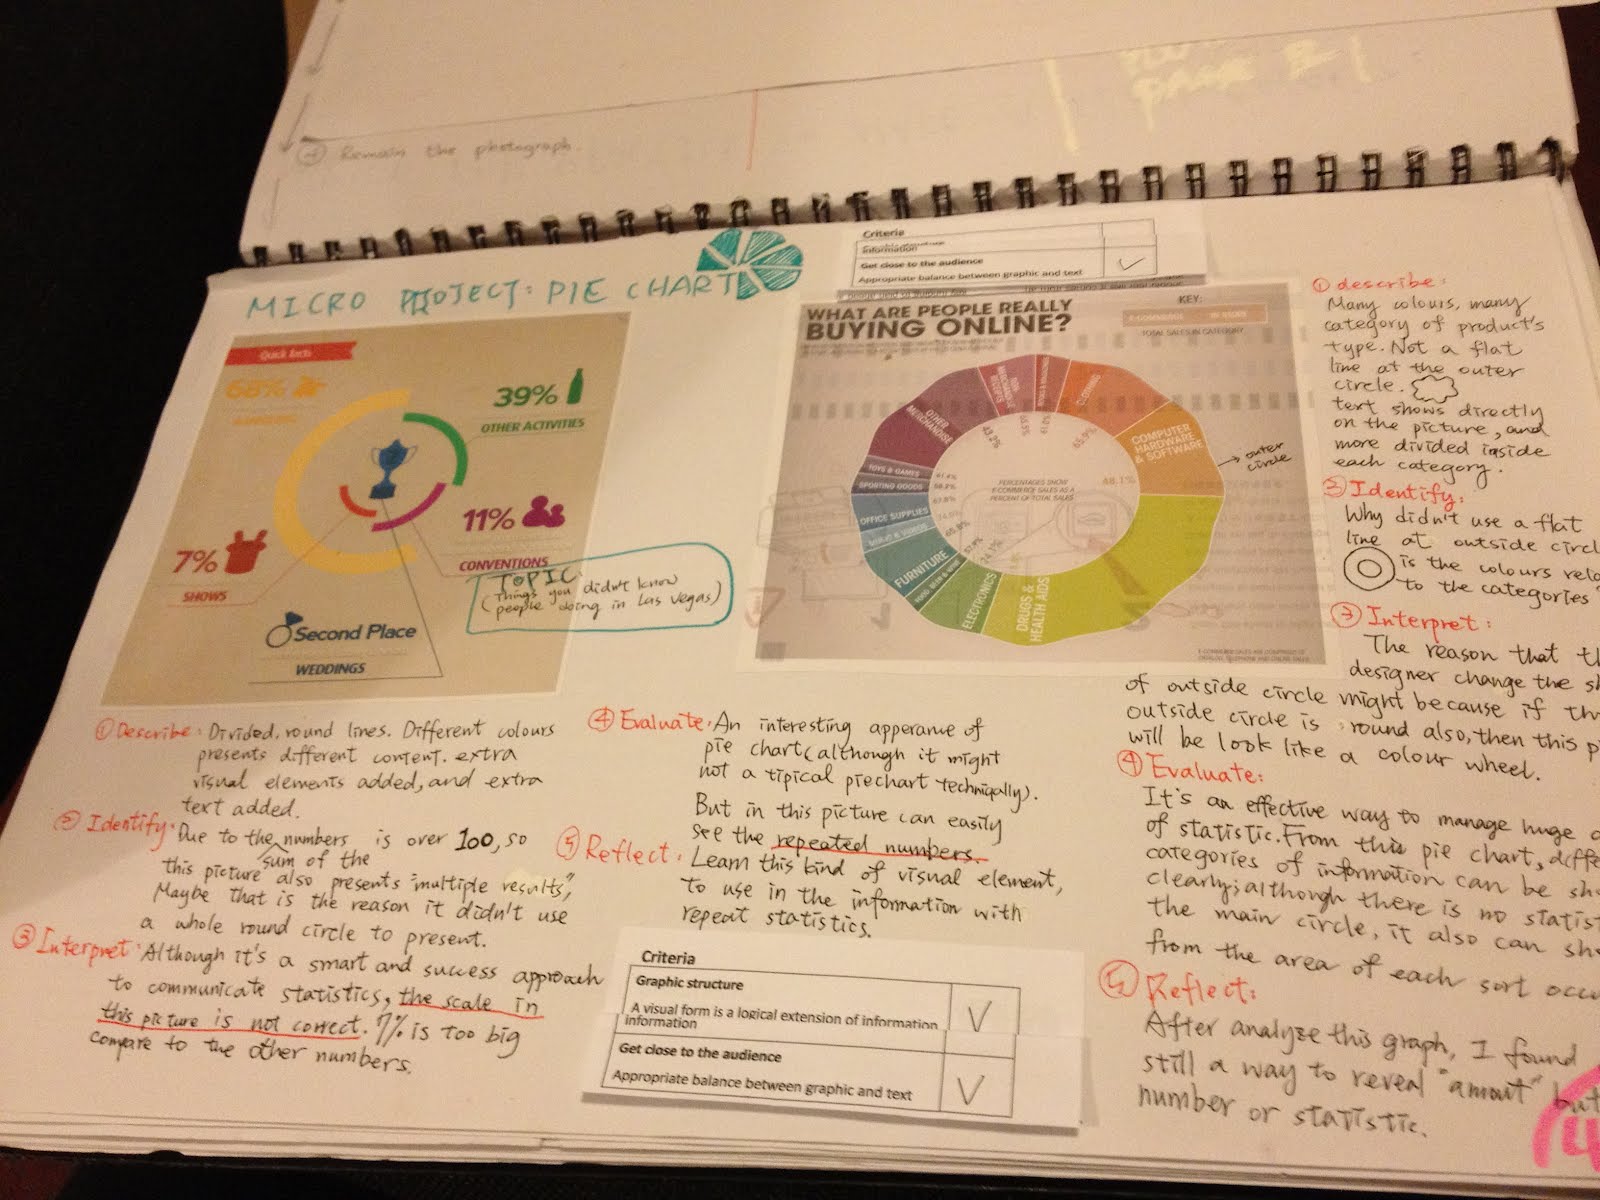
the study in different visual way in pie chart.
a prototype re-design of the topic of sea level rises.

沒有留言:
張貼留言